
Different questions need different views: How many cases are open? How are they distributed across the people responsible? Where do we stand compared to last month? Until now, answering that often meant several tools, several exports, and several views you had to piece together yourself.
What’s new
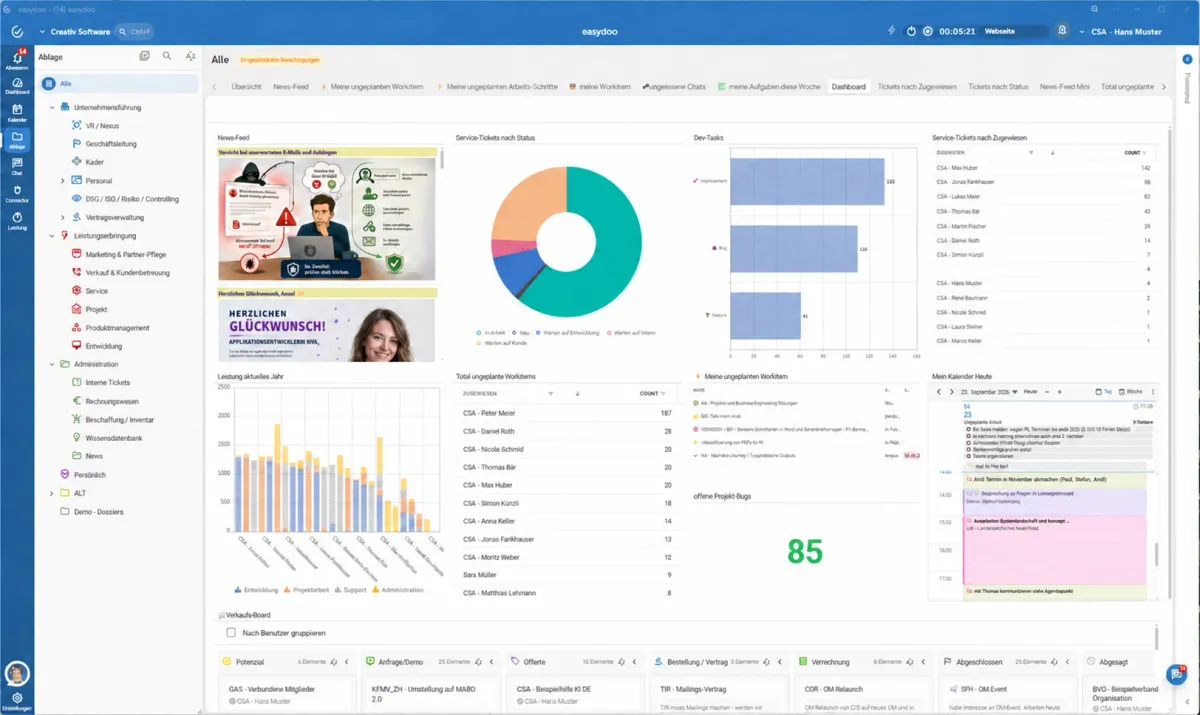
- Freely combinable dashboards. Aggregations, charts, pivot tables, lists and boards can be assembled into a single dashboard however you need it.
- Aggregations at a glance. Sums, counts, averages and other metrics come directly from your existing cases, with no separate export.
- Charts for a quick overview. Bar, line and pie charts show trends and distributions without any manual data preparation.
- Pivot analysis. Break down data across several dimensions at once — for example by status, responsibility and time period.
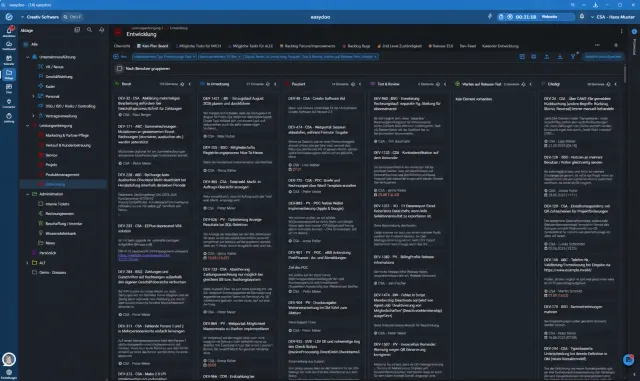
- Lists and boards in the same dashboard. Classic list views and kanban boards can sit right next to metrics and charts.
What this means day to day
Instead of one rigid standard report, every team, every manager, every process gets exactly the view it needs — from a daily overview with boards to a monthly analysis with a pivot table and chart. And because dashboards are built directly on your existing cases, they’re always up to date, with nobody having to gather data by hand.